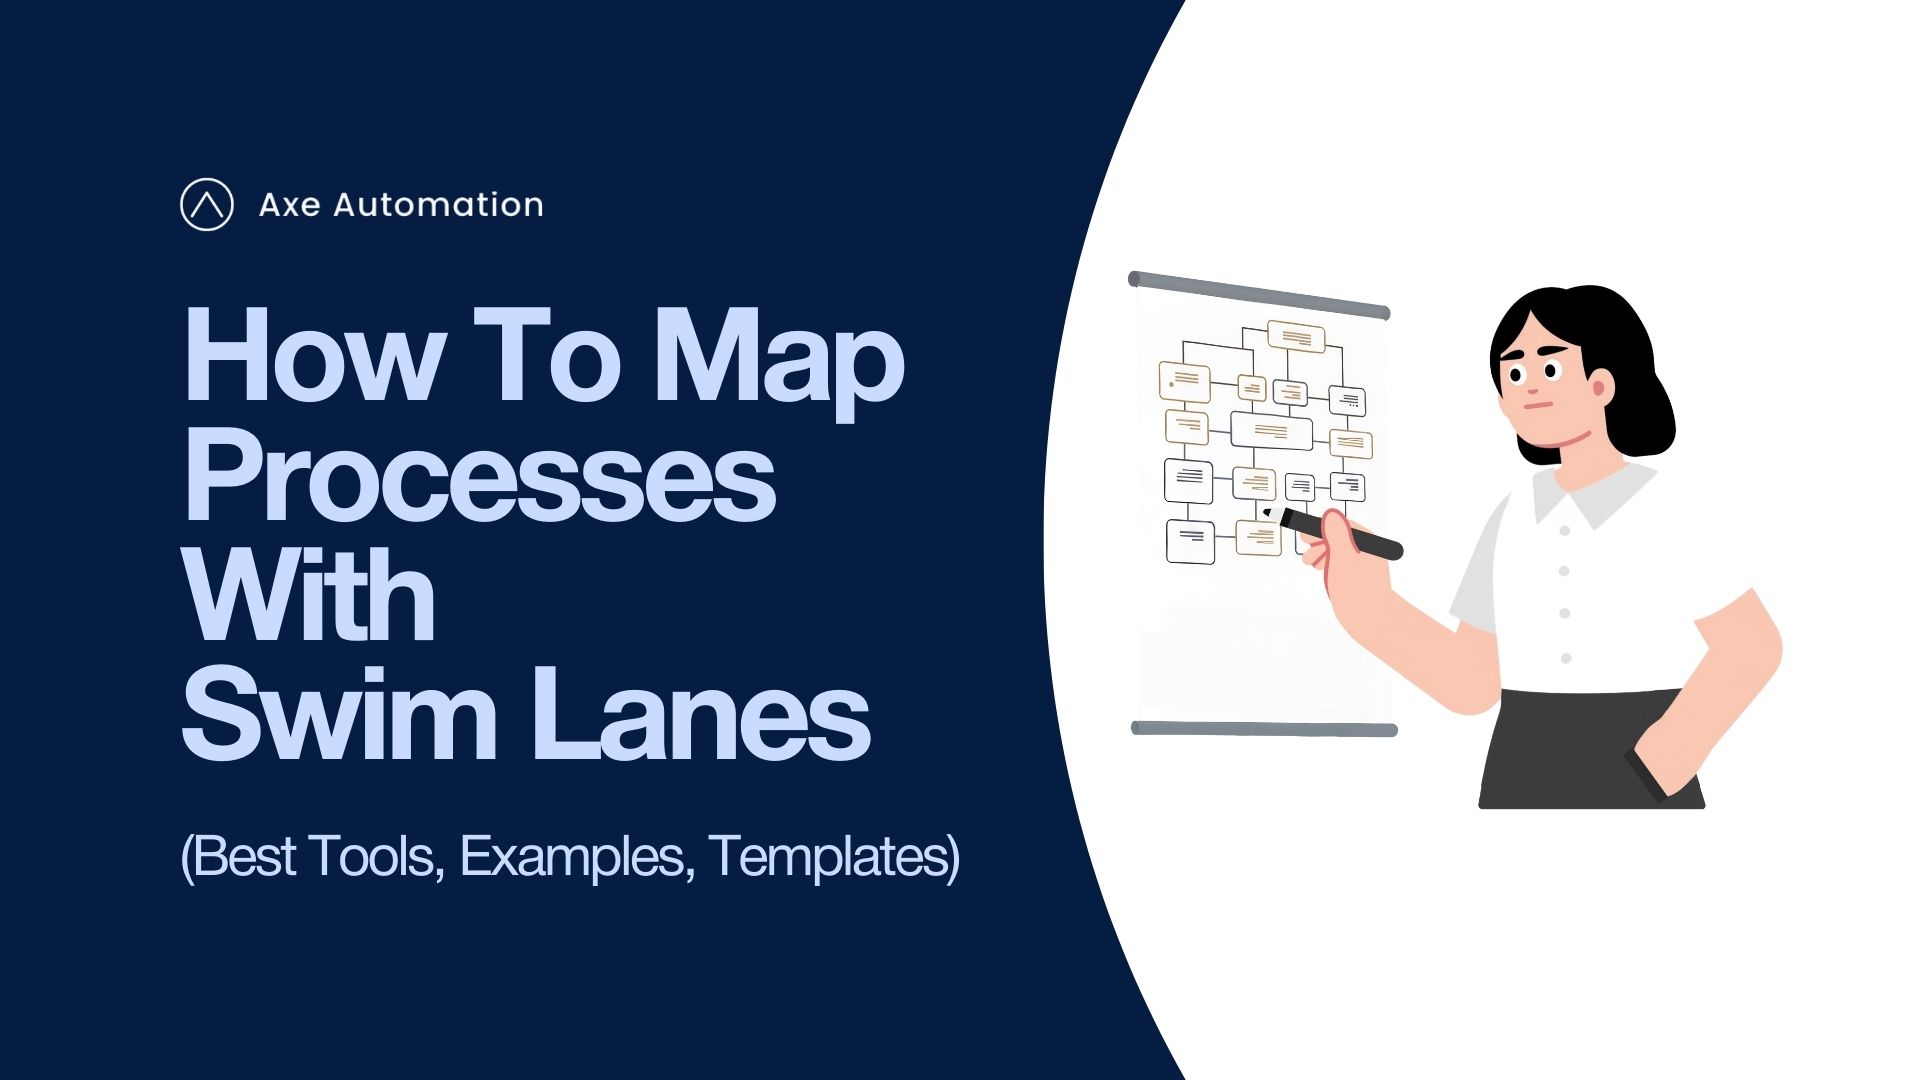

Picture this: You're running a marketing campaign. One person thinks they're creating the content. Another assumes approvals are done. Someone else thinks it's scheduled. But nothing was clearly mapped out.
Result? Revisions pile up. Deadlines slip. Everyone's busy, but progress crawls.
This is common in growing businesses where multiple people collaborate but responsibilities aren't clear. Swim lane diagrams fix this by showing who does what and when.
Watch our complete video tutorial above for a step-by-step walkthrough, or continue reading for the detailed guide.
Table of Contents
1. What Is a Swim Lane Diagram?
2. Understanding Swim Lane Structure: Two Simple Categories
3. Before You Draw: 5 Essential Preparation Steps
4. The 4 Basic Symbols You Need
5. Best Tools for Creating Swim Lane Diagrams
6. Real Examples: Swim Lane Diagrams In Action
7. 5 Practical Tips for Better Swim Lane Diagrams
8. 3 Common Mistakes to Avoid
9. When Should You Use Swim Lane Diagrams?
10. Getting Started With Swim Lane Diagrams
What Is a Swim Lane Diagram?
A swim lane diagram (also called a cross-functional flowchart) maps a process from start to finish while clearly showing who owns each step.
Unlike regular flowcharts that only show the sequence, swim lanes add accountability. Each lane represents a role or department. Every task in that lane belongs to that owner. This makes responsibility visible, not assumed.
Understanding Swim Lane Structure: Two Simple Categories
Swim lane diagrams organize processes using two dimensions:
1. Who Is Involved (Vertical Lanes)
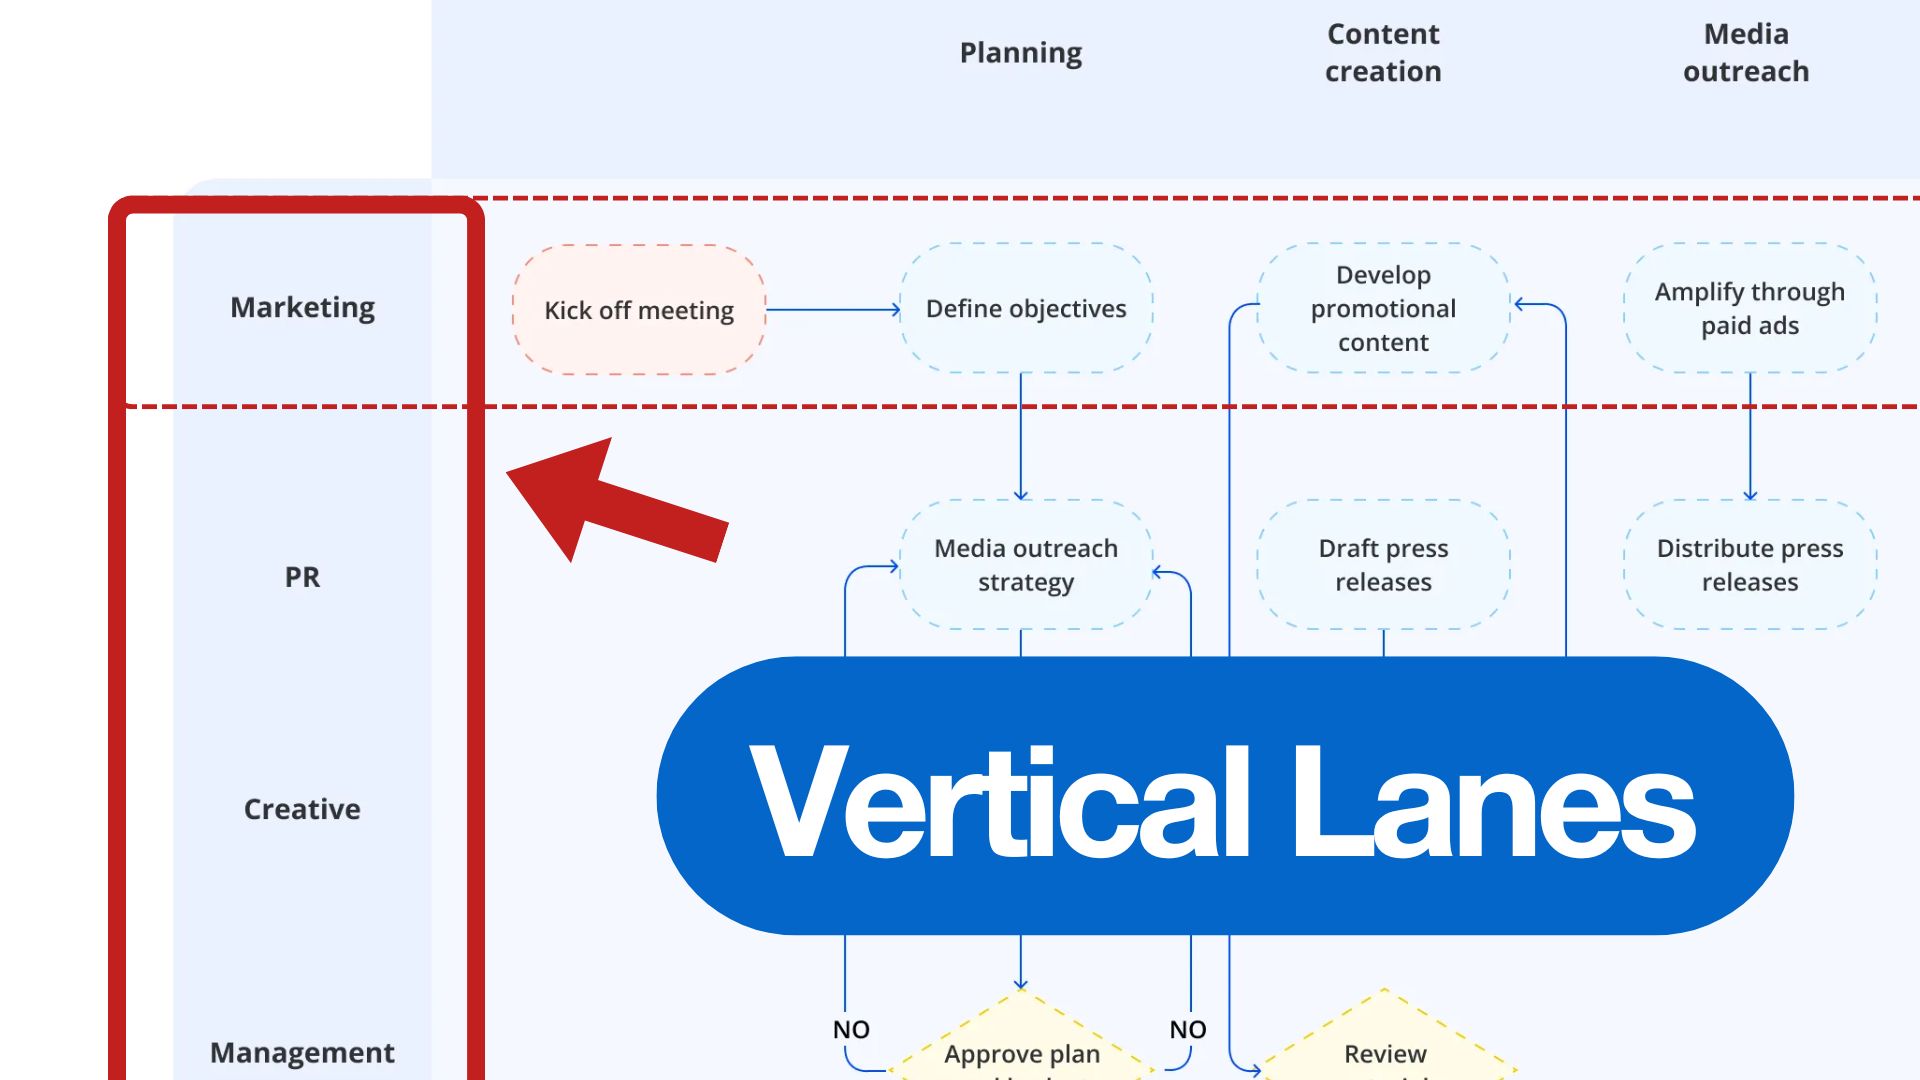
Each horizontal lane represents a role, team, or department. Activities inside a lane belong to that owner.
A flowchart shows what happens. A swim lane shows who is responsible.
2. Process Phases (Horizontal Flow)
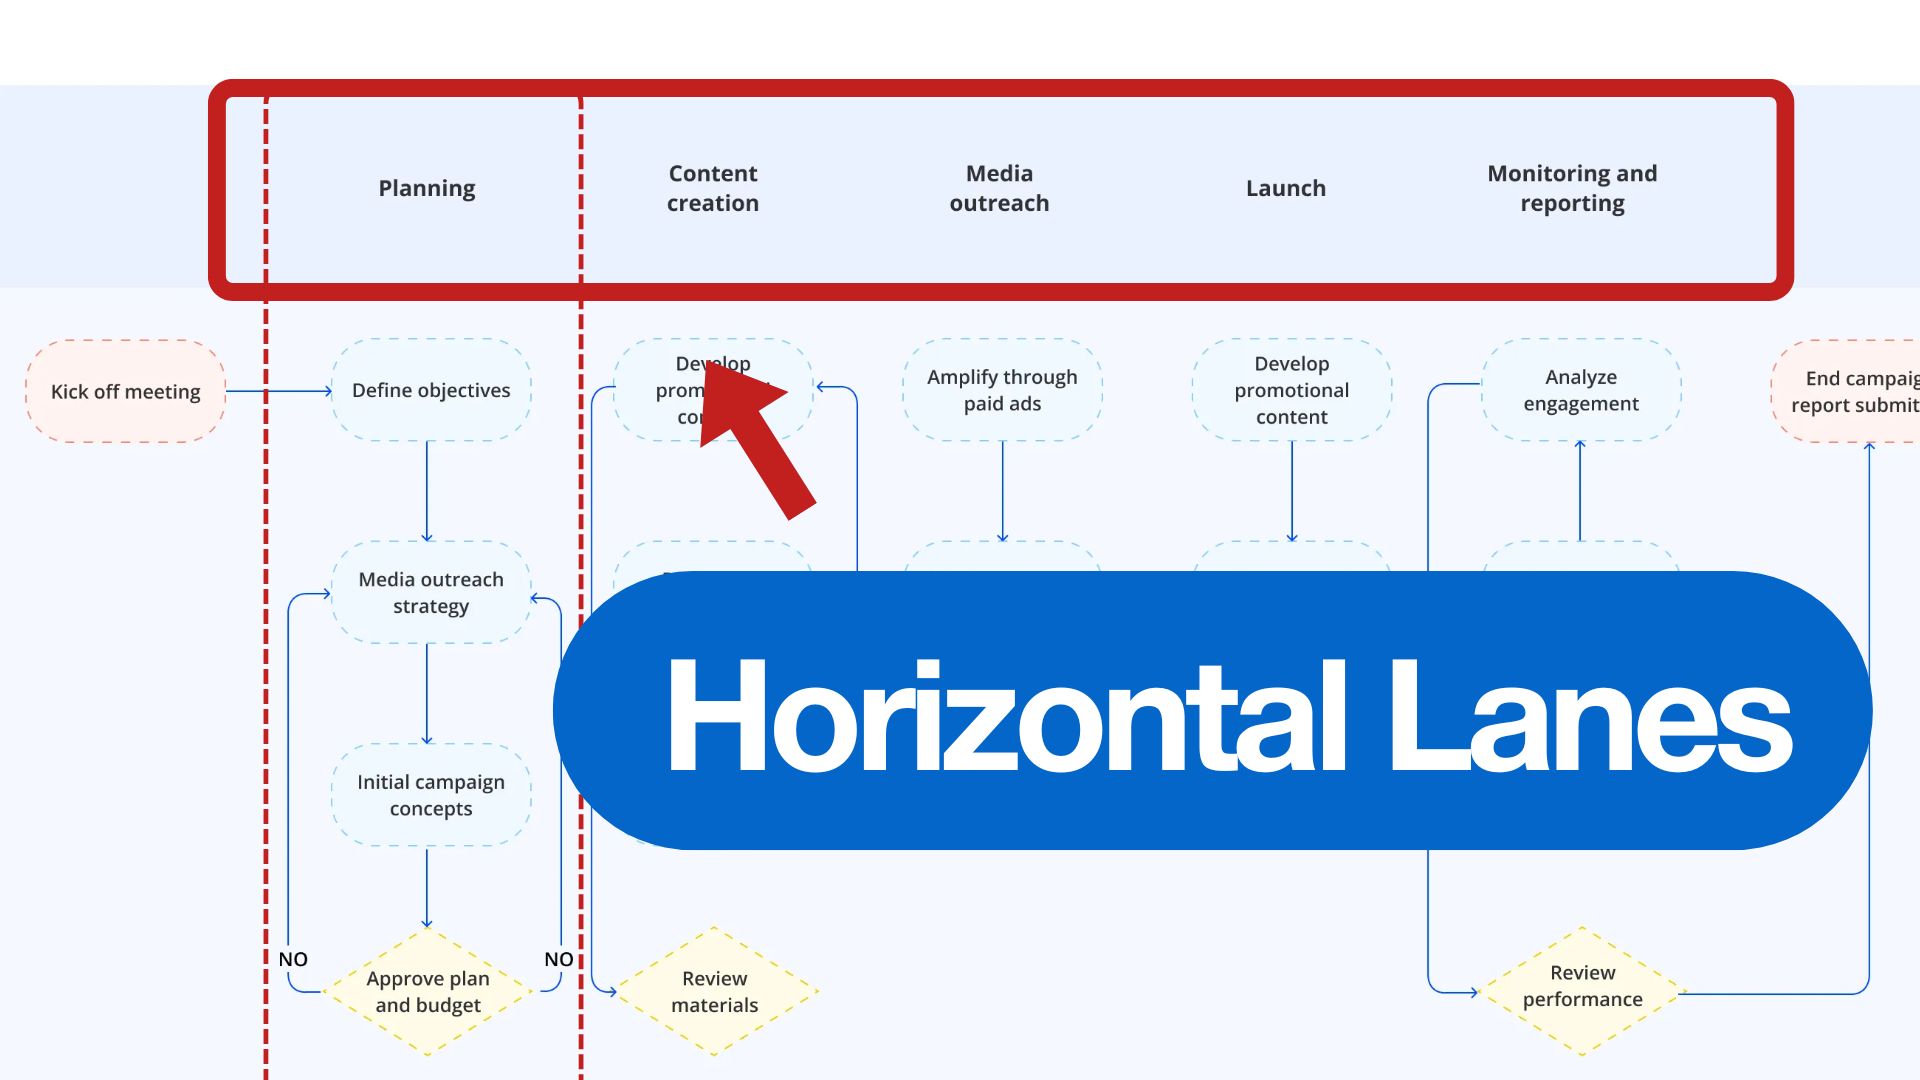
The horizontal axis shows timing. As you move left to right, you're moving through the process stages: initiation, execution, review, completion. This shows when things happen, not who does them.
Industry Note: Swim lane diagrams are recognized in Business Process Model and Notation (BPMN 2.0), an international standard for process modeling maintained by the Object Management Group. This standardization ensures that swim lane diagrams you create can be understood across different organizations and industries.
Before You Draw: 5 Essential Preparation Steps
Don't jump straight into drawing. Take time to think through the process first. Follow these preparation steps:
Step 1: Analyze the Core Logic of the Process
Break down the fundamental workflow. Identify who's involved, what they do, and how the workflow runs from start to finish. Talk to the people who actually perform the work. Don't just rely on how you think it works.
Step 2: Define Clear Start and End Points
Clearly define the boundaries of your process. What triggers the workflow to begin? What signals that it's complete? This prevents scope creep and keeps your diagram focused.
Step 3: Identify Functional Modules and the Core Path
Identify the main sections of the process and focus on the core flow first. Don't get distracted by every possible exception or edge case initially. Map the standard path that represents 80% of cases.
Step 4: Optimize the Sequence and Consolidate Exceptions
Simplify the sequence. Remove unnecessary steps, combine overlapping activities, and streamline the workflow. Look for redundancies where multiple people are doing similar tasks.
Step 5: Base Splits and Consolidations on Logic
Review where the process splits into different paths or comes back together. Make sure every decision point and merge is intentional and justified by business logic, not just habit.
The 4 Basic Symbols You Need
Swim lane diagrams use standard flowchart shapes. Here's what you need to know:
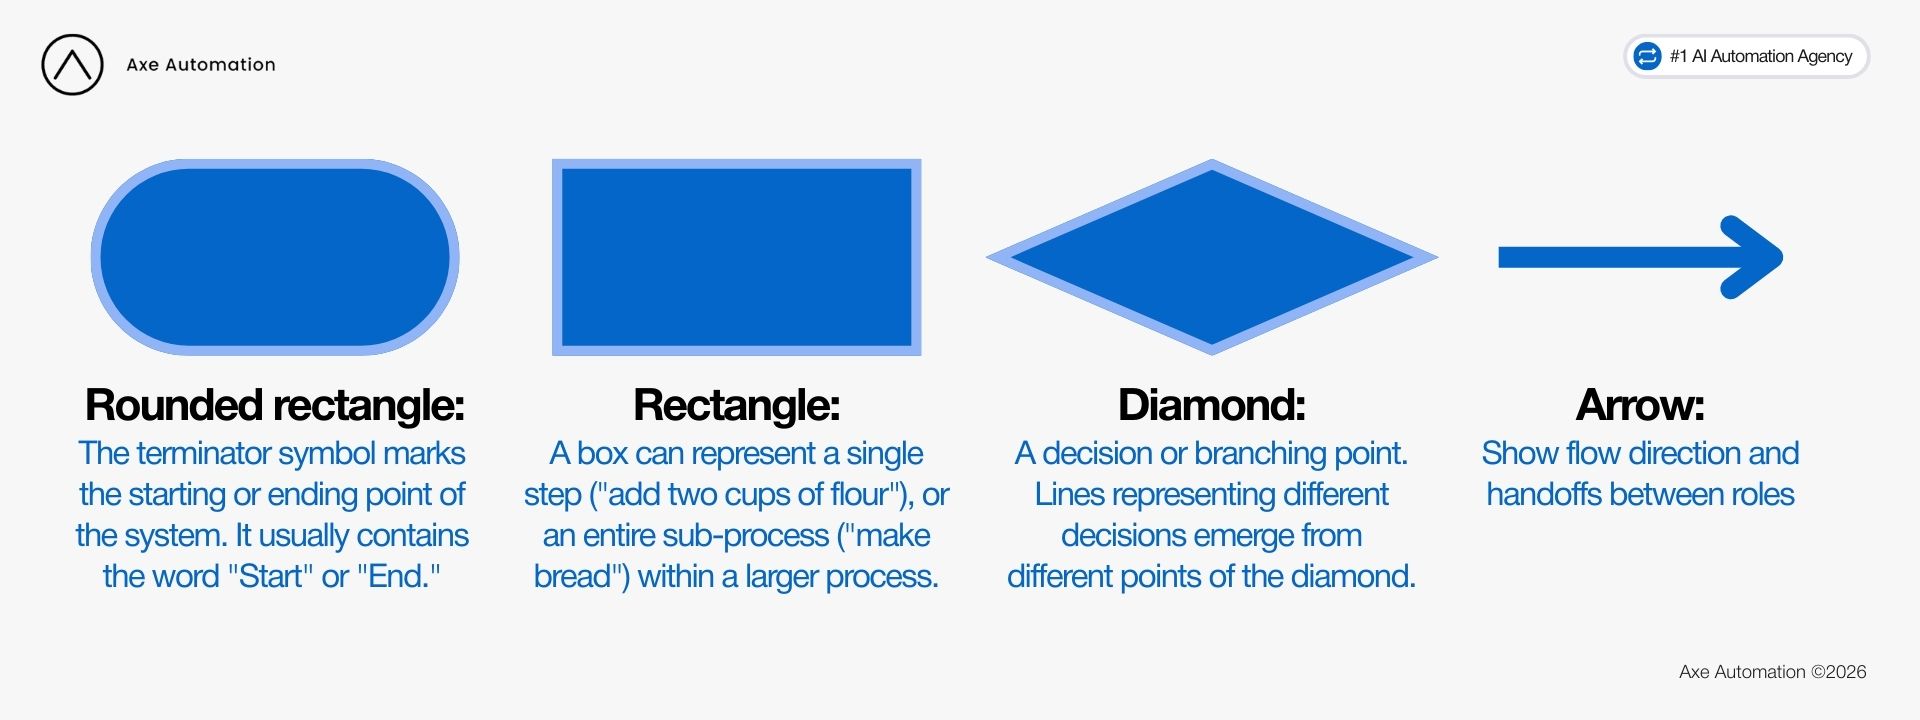
Rounded rectangle: Start or end of the process
Rectangle: An action or task
Diamond: A decision point
Arrows: Show flow direction and handoffs between roles
Best Tools for Creating Swim Lane Diagrams
You don't need specialized software. Start with what you already have:
For Quick Internal Docs: Microsoft Office
PowerPoint, Excel, or Word all support shapes and connectors. Good enough for basic swim lanes and internal documentation.
For Professional Diagrams: Microsoft Visio
Built specifically for process mapping. Offers templates, smart connectors, and professional output. Best for enterprise teams and complex workflows.
For Team Collaboration: Lucidchart
Web-based with real-time collaboration. Integrates with Google Workspace, Slack, and Microsoft Teams. Good for remote teams working together.
For Brainstorming: Whimsical or Miro
More flexible and visual. Some AI features for quick starts, but you'll need to manually organize swim lanes. Great for early-stage process mapping.
Pro tip: AItools can generate flowcharts, but they rarely create proper swim lanes. You'll still need to manually assign roles to lanes.
Free Swim Lane Diagram Template
Want to start quickly? We offer a free swim lane diagram template that works across popular platforms. Choose the platform that fits your workflow:
Perfect for creating visually appealing diagrams for presentations and client-facing materials. Includes built-in design elements and easy sharing options.
Great for rapid brainstorming and early-stage process mapping. Features real-time collaboration and quicki teration capabilities.
Best for collaborative workshops and team mapping sessions. Integrates with your existing Miro boards and supports unlimited participants.
All three versions include the same comprehensive template structure with pre-configured lanes, phase columns, and standard flowchart symbols. Simply pick your preferred platformand start mapping.
Real Examples: Swim Lane Diagrams In Action
Let's look at how different businesses use swim lane diagrams to map their processes. Each example show the visual structure makes accountability and workflow clear.
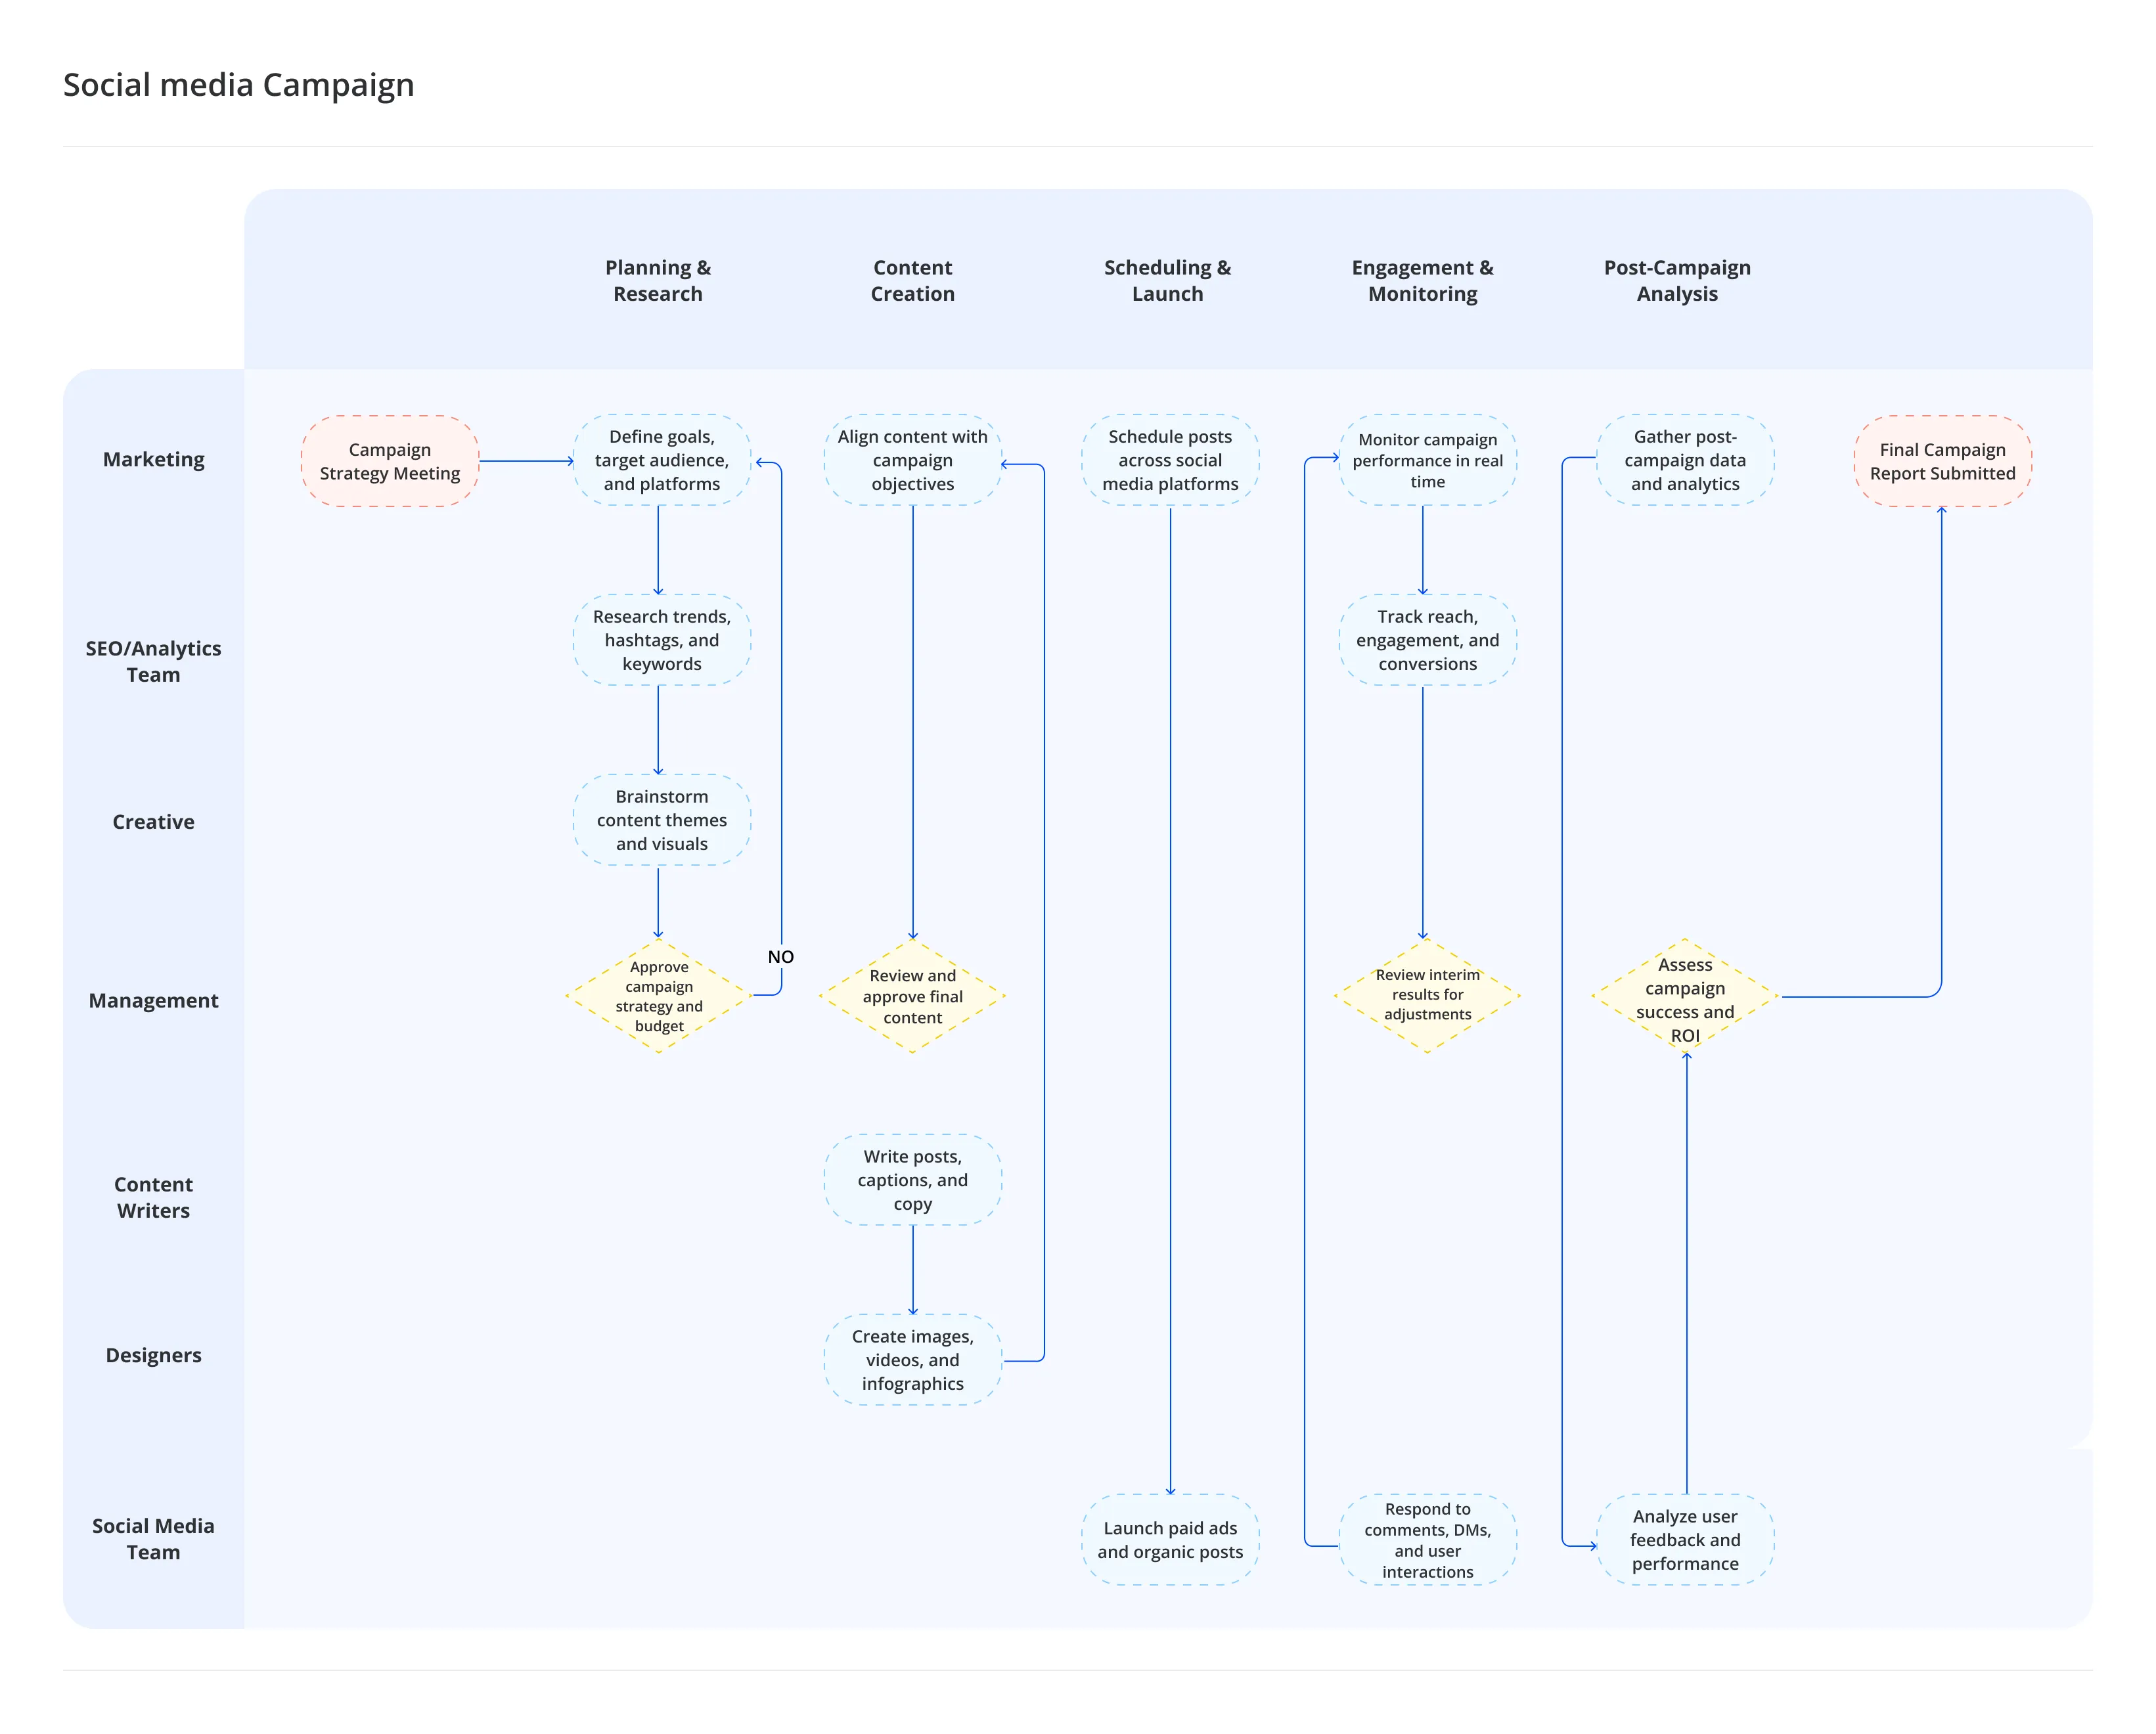
Example 1: Social Media Campaign Workflow
A comprehensive social media campaign workflow involving 7 different roles from Marketing to Social Media Team. From planning and research through content creation, scheduling, engagement monitoring, to post-campaign analysis. Notice how decision points (yellow diamonds) control the flow between phases, and how work moves between teams through clear handoff points.
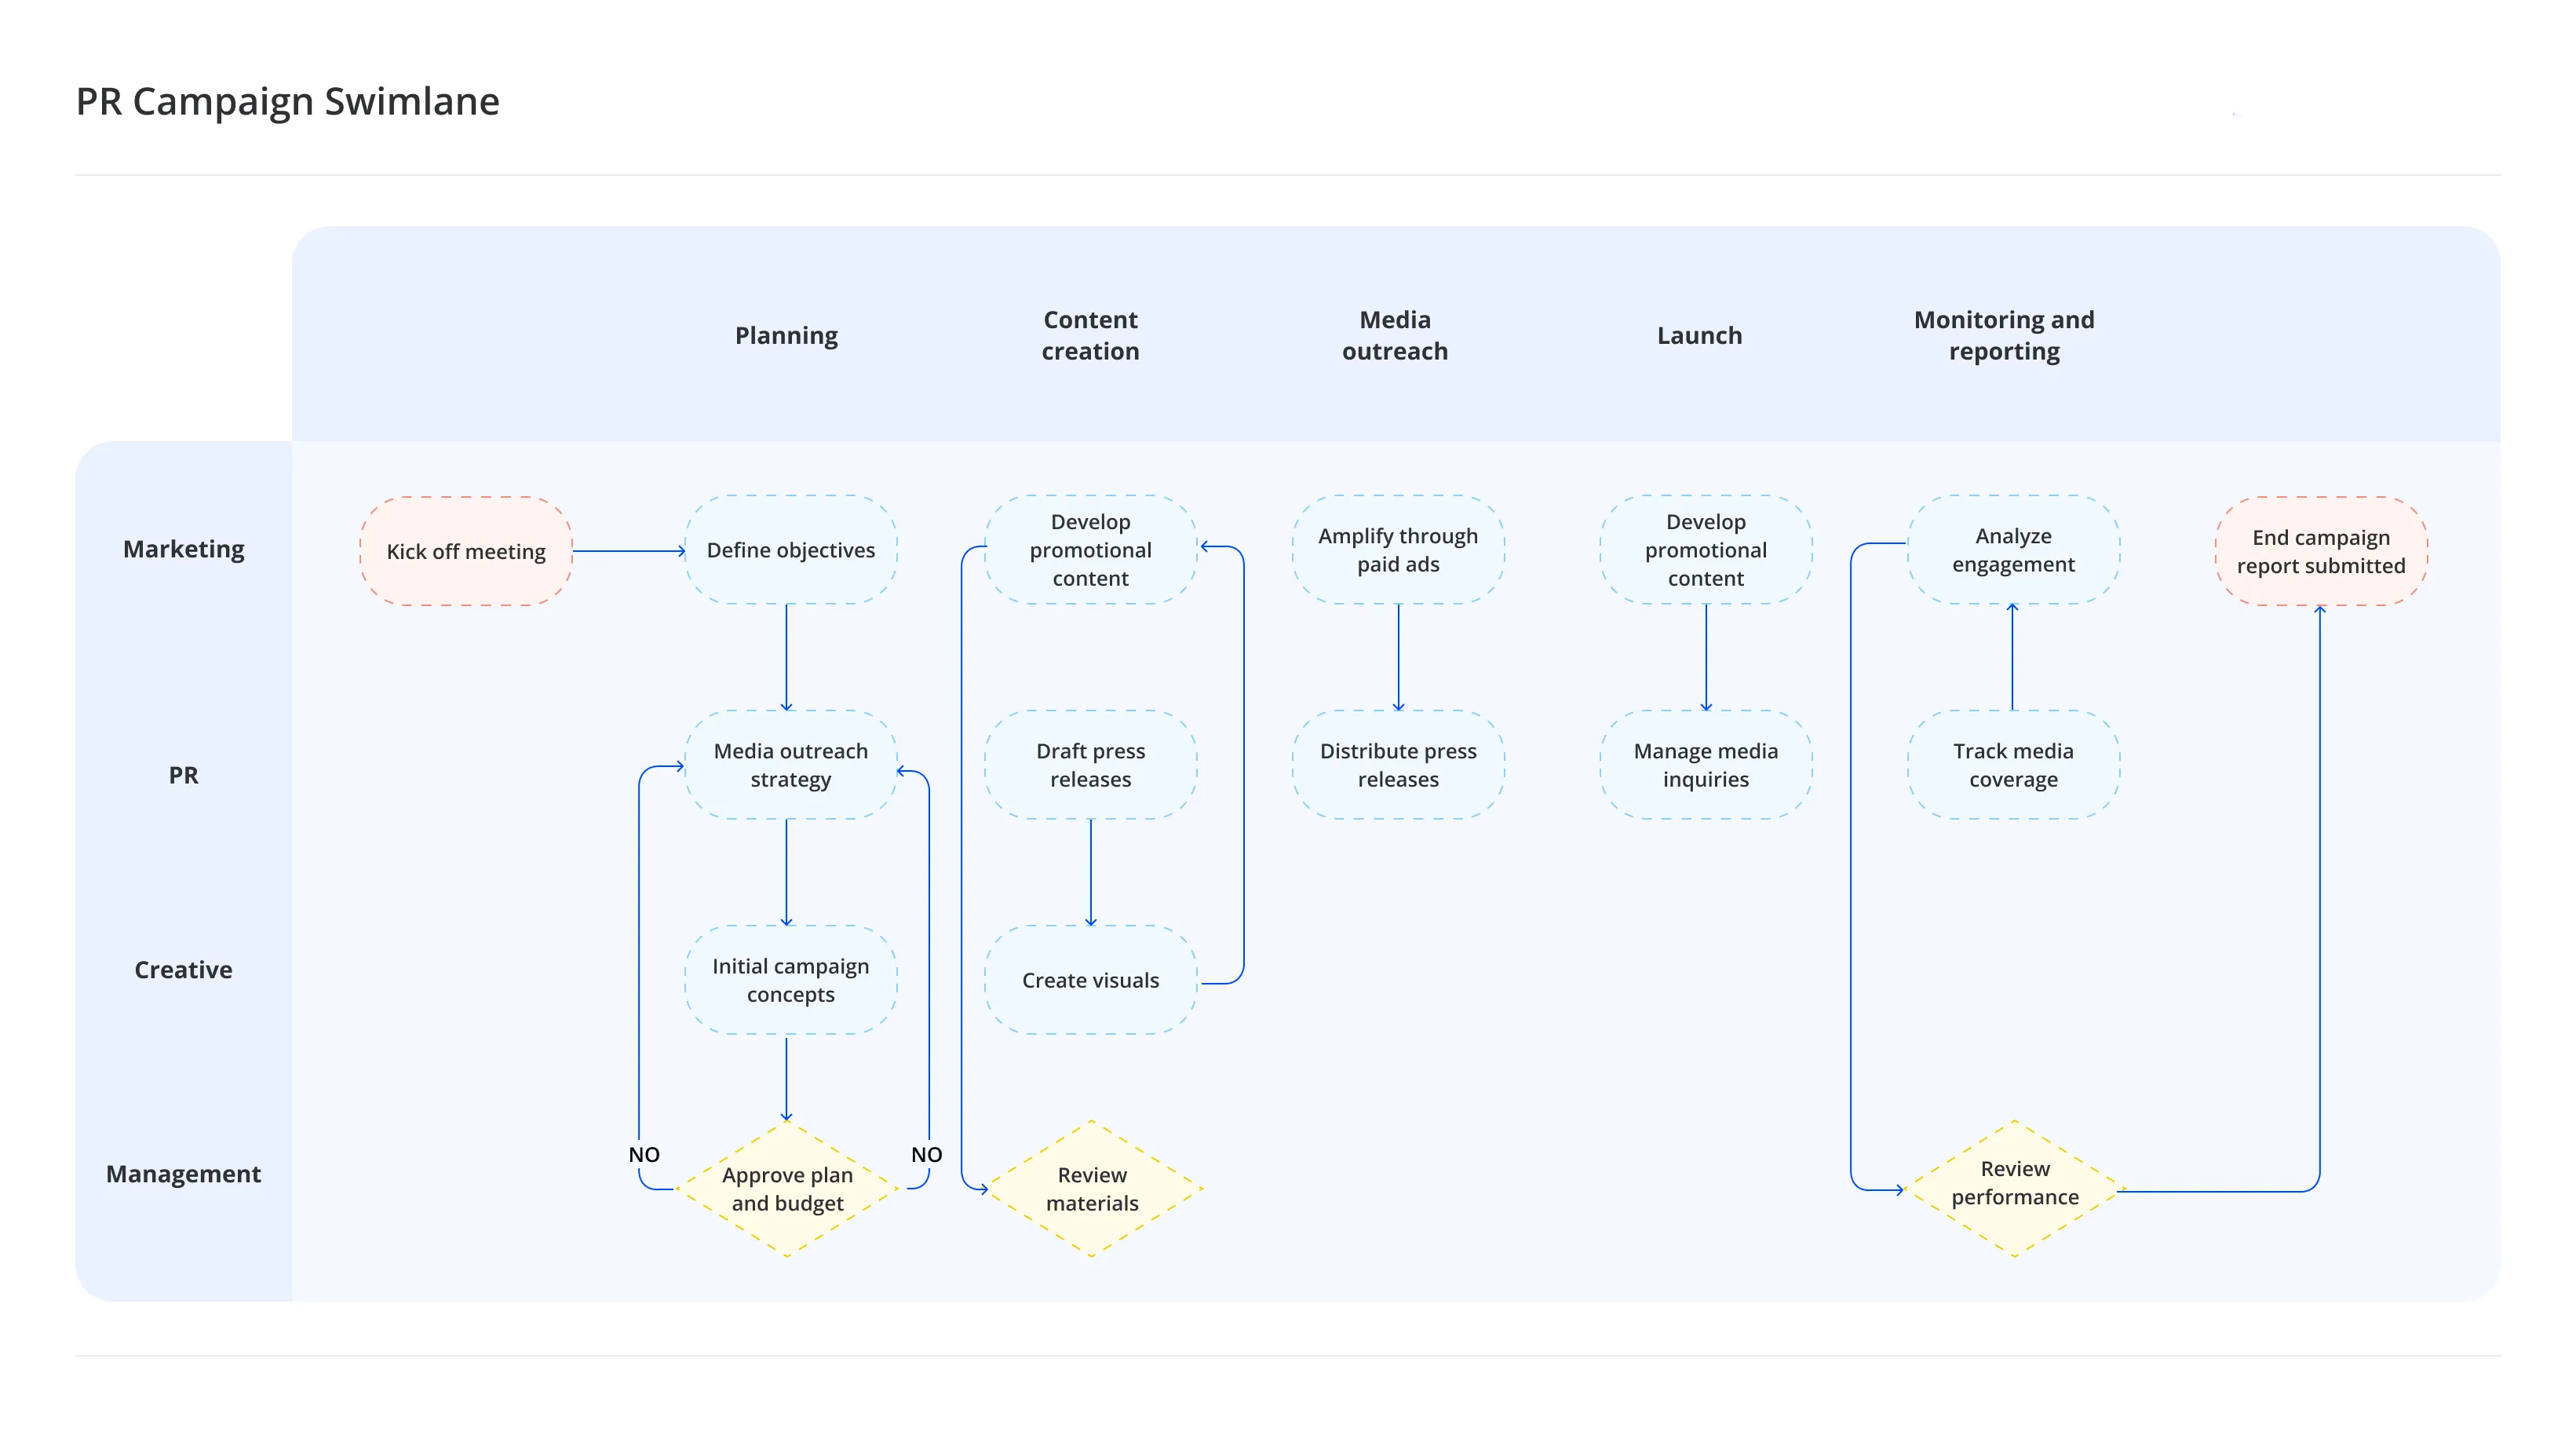
Example 2: PR Campaign Swimlane
This PR campaign diagram shows coordination between Marketing, PR, Creative, and Management teams across five phases: Planning, Content creation, Media outreach, Launch, and Monitoring and reporting. See how approval gates (decision diamonds) ensure management oversight before moving to execution stages. Each lane clearly shows which team handles which activities.
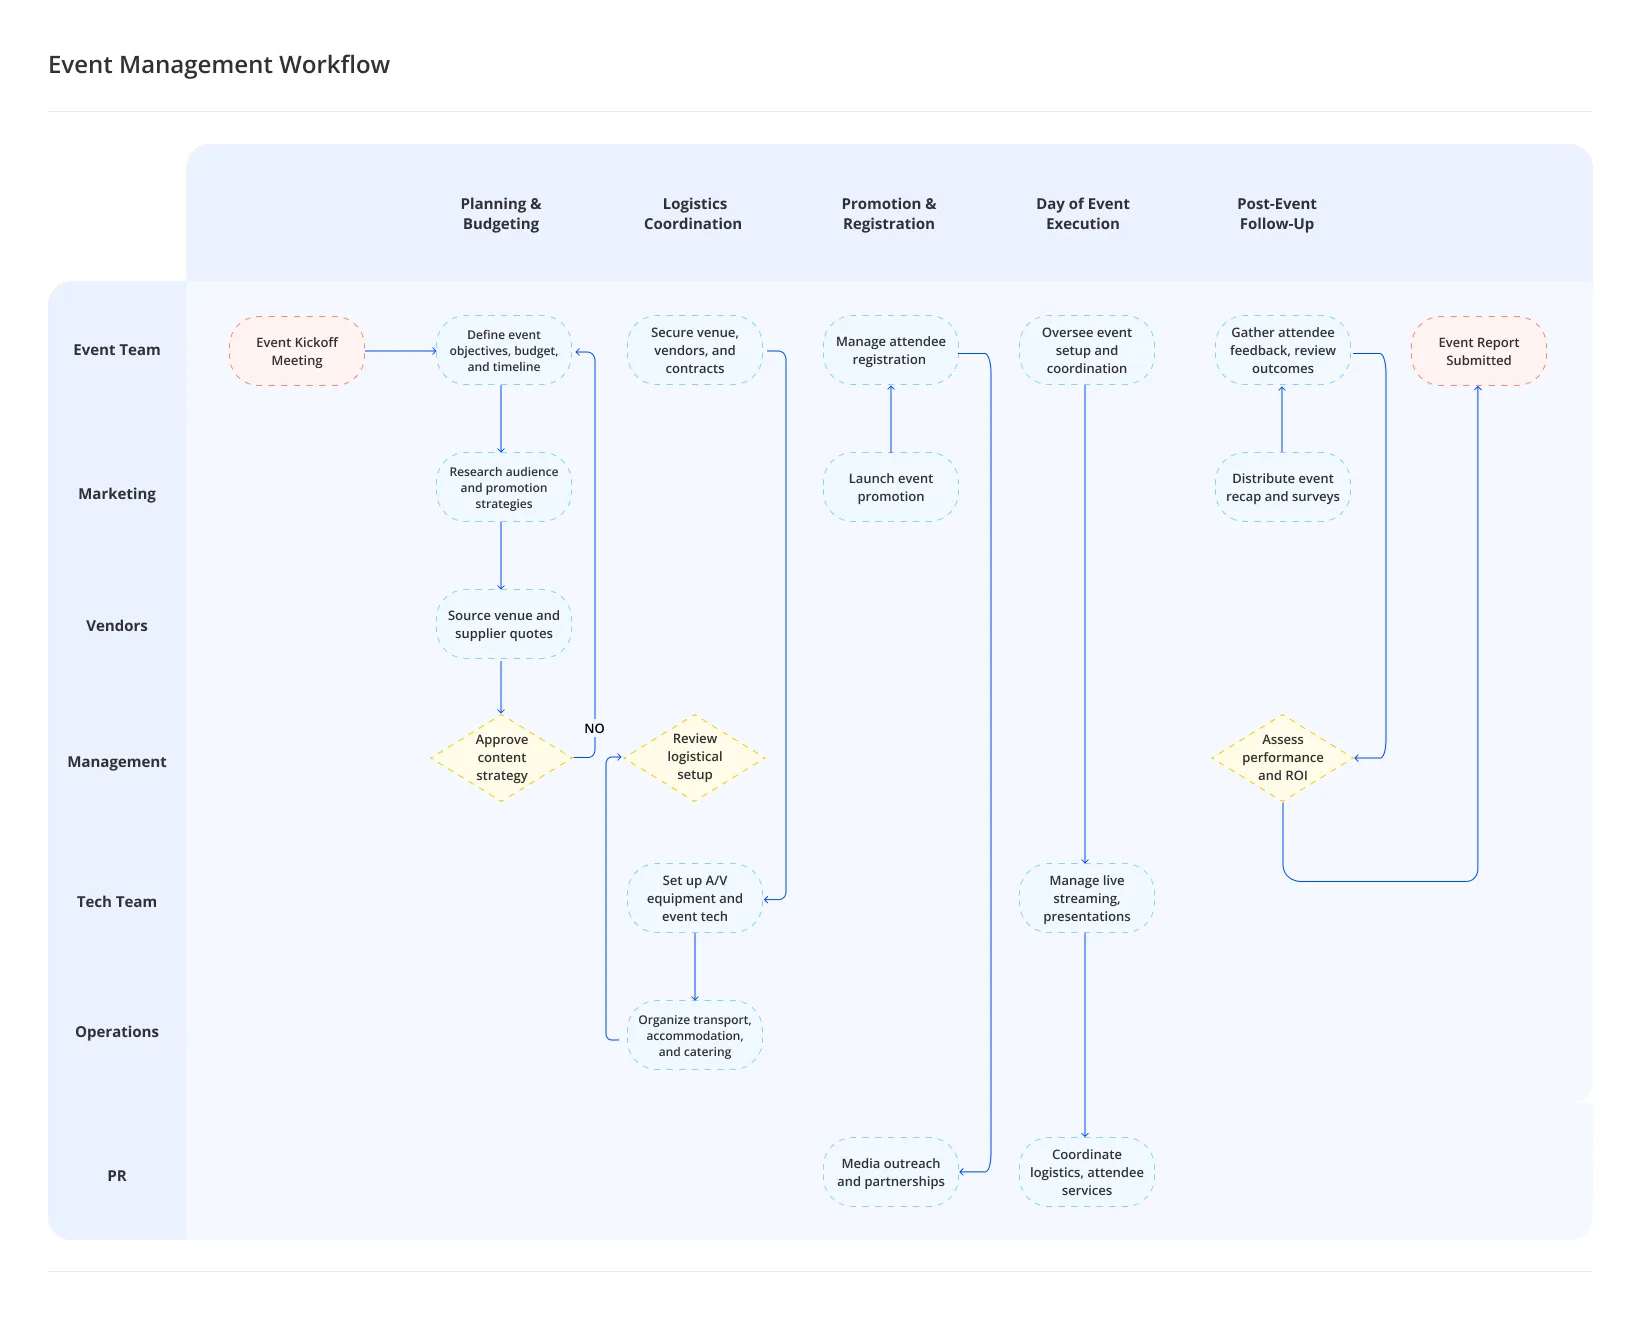
Example 3: Event Management Workflow
Managing events requires coordination across 7 teams including Event Team, Marketing, Vendors, Management, Tech Team, Operations, and PR. This diagram maps the complete journey from initial planning and budgeting through logistics coordination, promotion, day-of execution, to post-event follow-up. The horizontal phases organize the timeline, while vertical lanes show exactly who is responsible foreach activity.
What These Examples Teach Us
Look across these diagrams and you'll notice patterns:
Complexity varies by need: Simple PR campaigns (4 roles) to complex social media workflows (7+ roles) all benefit from swim lanes.
Decision points are visible: Yellow diamonds show where approvals or choices affect the flow.
Handoffs are clear: Arrows crossing between lanes show exactly when work passes to another team.
Phases organize timing: Horizontal columns (Planning, Execution, Review) show progression over time.
These aren't just pretty diagrams. They're working documents that teams reference daily to stay aligned.
5 Practical Tips for Better Swim Lane Diagrams
1. Keep it simple. Focus on the core workflow. Document the 80% case first. Create separate diagrams for major exceptions if needed.
2. Use action verbs. Label tasks with verb-noun pairs: "Review content," "Approve budget," "Send email." Avoid vague labels like "Process" or "Handle."
3. Label decision paths clearly. When using diamonds, mark each arrow: "Approved/Rejected" or "Budget > $10K / Budget ≤ $10K."
4. Validate with real users. Walkthrough the diagram with people who do the work. They'll catch what you missed.
5. Update regularly. Processes change. Review diagrams quarterly. Outdated diagrams create false confidence in wrong procedures.
3 Common Mistakes to Avoid
Making lanes too granular: Don't create a lane for every individual person. Group by role or function. Sarah and Mike from marketing share the "Marketing" lane.
Confusing phases with roles: Phases are timing (when), not ownership (who). Don't make lanes for "Planning Phase." That's a column header, not a swim lane.
Including too much detail: If your diagram has 50+ boxes, you've gone too deep. Swim lanes show significant steps, not every micro-action.
When Should You Use Swim Lane Diagrams?
Swim lanes work best when:
• Multiple roles or departments need to collaborate
• People regularly ask "whose job is this?"
• Work consistently gets stuck at handoff points
• You're onboarding new teammembers to complex processes
• You need to identify improvement opportunities
For simple single-person tasks or purely sequential work with no decisions, a basic checklist is enough.
Research Insight: IBM's2024 Process Intelligence Study found that organizations using structured process mapping techniques identify 65% more automation opportunities and reduce process cycle times by an average of 40%. Visual process documentation like swim lane diagrams makes bottlenecks visible, enabling data-driven decisions about where to focus improvement efforts.
Getting Started With Swim Lane Diagrams
Swim lane diagrams aren't just documentation. They reveal how work actually happens in your business. When responsibility and timing are clear, inefficiencies become visible and decisions improve.
The real value isn't in the diagram itself. It's in the conversations that happen when you create it. Sit down with your team. Map out one critical process. You'll discover assumptions, gaps, and opportunities that were invisible before.
Start small. Pick one process that causes confusion. Map it. Validate it. Improve it. That single exercise will show you the value better than any explanation.


